The first thing you should figure out when programming in C# is which editor you should use. Microsoft has created Visual Studio and – in my opinion – it’s one of the best IDEs to use for C#. In this article, I am going to show you the windows and tools you should use while programming in C#. It’s impossible to show you everything.
Table Of Contents
Goals
This article is to show you some features of Visual Studio. Maybe you won’t use them or maybe you will use other features or windows, but these are the ones I use the most.
After this article you:
- Know how to start a new project and solution
- Understand how to search for features in Visual Studio
- Are able to locate errors
- Create bookmarks on lines of codes
- Run your application
- Can investigate some performances of your application
Starting Up Visual Studio
After you have installed Visual Studio you want to start it. The first time you start Visual Studio you are asked to sign in. This is optional, but I would recommend it. If you sign up or sign in Visual Studio will store your preferences in the cloud. As said before: this only happens the first time and only once.
After that, you will see the following screen:

I have installed Visual Studio 2022 Preview, which means I get some previews of new features. It’s not really that special, but you can get the preview version of a new .NET version before it’s released.
If you use Visual Studio more, your recent projects or solutions will fill. For now, you have 4 options, on the right side of the screen:
- New Project
If you want to start a new project you select this option. After creating a project a solution will be created too. - Open Project
If you have a previous project or solution on your local drive, you can open it by browsing over your disk. - Open Folder
Same as the previous option, but now you open a folder, not a project or solution. This option is usually used with non-Microsoft solutions, like Angular, ReactJS, or HTML files in a folder. - Clone Repo
If you have access to a GIT repository you can clone that repository. I will not explain this further in this tutorial
Create A New Project
For this tutorial, I am going to create a new project. I select “New Project” and the next screen is presented.

This shows all the templates “my” Visual Studio has to offer. The types and amount of templates are determined by the installation of Visual Studio. If you haven’t installed web development, templates like “APS.NET Core Web App” wouldn’t be showing here.
Please note the tags. I will be using C# and I am programming on a Windows computer. For me, the template must have the C# and Windows tags. The C#-tag is important. VB-tag is also present in my templates, but that’s a different language.
For this tutorial, I am going to create a Console App. You can find it by searching for it in the search bar, the one that says Search for templates (Alt+S). Click Console App and press Next.
Configure Project
This screen shows some options. Please be aware that each template has different options. Project name, location, and solution name are common. But a web template also has options to set HTTPS, docker, and other options. A console app is quite simple.

The project name is the name of the console app, or whatever template you have selected. Let’s keep it simple for now and call it HelloWorld.
The location is the place on my hard disk where I want to store all the files. By default, Visual Studio will place your projects in the c:\Users\UserName\source\repos. Which is fine, I guess, but you can change it if you want.
The solution name is the name of the container that will hold all the projects. Microsoft uses solutions and projects. A project is a console application, web application, class library with logic, or Windows application. But you will create multiple projects to keep your code separated and in a structure.
A solution holds all those projects together. See it as a keyboard: It has all these keys (projects) held together in a frame (solution). In this case, the solution will hold the console app “HelloWorld”. Usually, you will add class libraries later on for logic, which will also be in the same solution. I try to name my solution meaningfully, like the name of this tutorial.
Let’s press “Next”.
Additional Information

Like I said before; some templates require extra information or settings. The console app requires knowing what version of .NET you want to use. I will be using .NET 7. Note that .NET 8 will be released in November 2023.
That’s it! Let’s create a new project. Press “Create”.
Default Window Layout In Visual Studio
Depending on the speed and power of your machine, Visual Studio will scaffold all information and files for the console application. This shouldn’t take long, since the console application just has 1 file. When Visual Studio is done you should see something like this:

This is the default window layout for Visual Studio. Very obvious is the code editor on the left, which is the tab Program.cs. Here you can add or change code. On the right, you have the Solution Explorer and Properties panels.
The Solution Explorer shows all the projects and files within the solution. This page is the second important pane in Visual Studio. Here you can add projects, files, packages, and much more.
The properties panel shows the properties of selected files or projects in the solution explorer. If you are creating a WinForms application, this panel will show you the properties of the components you are using in your form.
Each panel, and any other in Visual Studio, can be dragged to a different location, and you’re able to show, hide, or close it.
While these three panels are important, Visual Studio has much more to offer. I won’t go through them all, since that is impossible. I will just point out the most important parts.
You can change the layout by dragging windows around, opening other windows, or closing them. You can also, like me, drag windows to another screen and divide them over both monitors for a better overview. To save your layout you go to Window -> Save Window Layout and give it a name. Never change the default layout!
Search
I start with the search. By search, I don’t mean searching in your code but searching throughout Visual Studio. The application has so many options, that it will become impossible to remember where all the options, settings, windows, and panels are.
To access the search press CTRL+Q or press the search button at the top of Visual Studio.
An example: If you click on “Dependencies” in the solution explorer and next click somewhere in the code editor, you will notice that the highlighted item in the solution explorer still is Dependencies. It would be better if the active document is highlighted. Especially in bigger projects, with lots of files, it is convenient to know where the file is you are editing. We call this highlighting Active Tracking and it’s part of the Visual Studio settings.
Now to turn it on: Click in the search bar, or click CTR+Q, and type “active”. You will see “Turn Track Active Item on or off”, that’s the one.
Click that. A new screen will show you the correct options category where you can find the setting.
This is just a small example. You can also find windows and panes with this search. Close the Solution Explorer for example. Now go back to search and type “Solution”. It will show the option for “Solution Explorer”. Click this and the Solution Explorer will be showing again.
Errors
When we create applications, errors will occur. Sometimes because of a miscalculation or sometimes because of typos, where the latter is the most common. I will focus on typos in this next part. When you make a typo, the editor will add a red curly line under the typo. Usually when you type the wrong name of a variable. This is easy to fix because you see it.
But, what happens if you have an error deeply hidden in some other file you are not editing? You won’t see it that quickly. You start the application and you are prompted there are build errors. Let the hunt for the errors begin!
Well, not quite. There is a window in Visual Studio that shows you errors at design time, meaning you are coding and making an error. We call this the Error List. This window isn’t shown in the default layout, but it can be found under view -> Error list. Or you can find it by using the search option I explained earlier.

This window describes the error, which usually makes you understand what is going on. It also shows you the location. When you double-click on an error you jump to the location of the error and you can change/fix it.
Toolbar
Apart from these windows and panes, you have a big toolbar at the top with some cool features:

Not all options are worth mentioning at this point and some might look familiar, like the save and open options. I will talk about a few options.
Run Configuration

This first option is important. Here you can select how you want your application to run. The default is Debug, which means you are running a debug version of your application. Another option is Release, where you run the release version of your application. Although you won’t notice much difference, there are differences!
A debug version has not been optimized. A release version is optimized but is harder to debug. Sometimes, but not that often, a debug version of an application behaves differently from a released version. It’s important to run the release version before you distribute it.
A third option is to configure the configurations and set a configuration per project if you have more than one. You can also create a new configuration if you want. This gives you more control over the build configuration you are using.
The dropdown with Any CPU gives you control over what bit process you want to run. This is 64-bit or 32-bit, depending on your system. The “Any CPU” option will use the correct bit for you.
Run Options
Right to the run configuration is run options. In short: start your application.
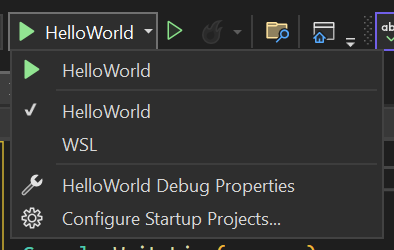
The option with the green color (left one) is the most important button in Visual Studio. It allows you to start the application. If you expand it you see some options. The WSL option means you can run your application under Linux. For this to work you will need to install Linux.
Right to the run-button is another run-button. This does the same as the left one, but without debugging. You can start the application, but you are not able to debug the code. To be honest: I have used this button once… by accident.
The red-flame-like button is a nice addition, which is recently added. This button is called Hot Reload. Especially useful when you are making web applications. What it does is this; You run the application and you change code while the application is running. Then, when you are done coding, you press the Hot Reload. The application doesn’t reload or restart but modifies the code and you can test it without restarting. Cool, huh!?
Bookmarks

Something that people don’t use often in Visual Studio: Bookmarks. The idea is simple: You need to remember a line; you need to change it later. Most people add a comment with the text “//ToDo”. Now, I hate comments, especially the to-dos. The more comments you will use, the harder it is to read the actual code. But personal issues aside, bookmarks can help you.
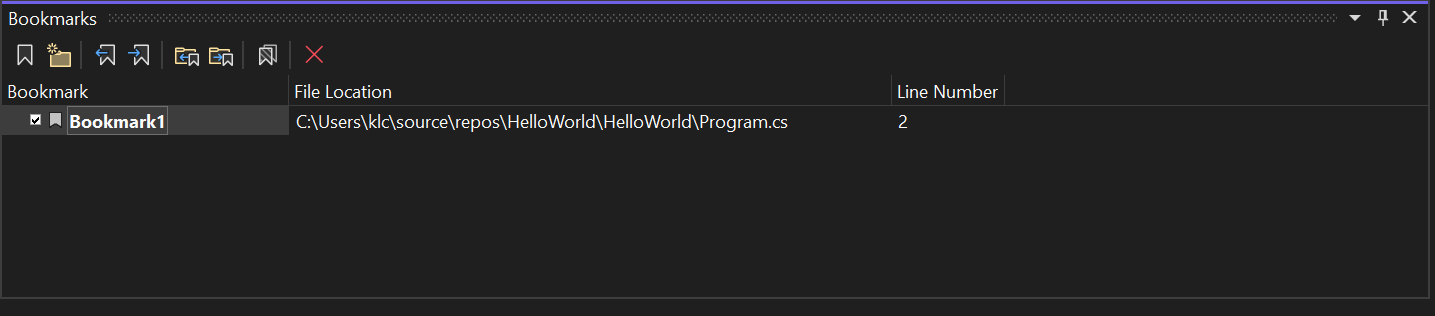
This is what you do: Go to a line of code and press the bookmark icon. That’s the left icon of the previous image. A small icon will appear left of your line of code. Now open the bookmark-window (view -> Other Windows -> Bookmark window, CTRL + W + B, or via the search). You can now see your bookmark in a list. If you double-click on a bookmark in that list, you will jump to that line of code.
You can also rename a bookmark, so it has more meaning. The buttons above the list of bookmarks allow you to navigate through the bookmarks (next, previous, remove, etc).
Visual Studio At Runtime
Visual Studio has two faces: Design time and run time. I just ran through some basic stuff of the design time. If you run the application you will notice the layout changes. Some windows are removed or hidden (Solution Explorer) and some windows appear (Diagnostic Tools, Locals, Watch 1, Call Stack, Exception Settings, and Immediate Window). You can close or open other windows as you like. The next time you start your application the same layout will be shown, so you don’t have to change it again.
So, if you start the application by pressing F5 on your keyboard or the green run button in your toolbar, you should see something like this:

Note: I have added Console.ReadLine() to hold the application. If you don’t add this, the console application is finished and you won’t see them at runtime windows.
I won’t cover all the windows, just the important ones.
Diagnostic Tools
Basically, a window that shows you memory usage, events, and process CPU usage. I usually close it since it bothers me seeing this thing move all the time. But, when I am further in the process of creating an application, I sometimes check it if it doesn’t use an enormous amount of memory.

Especially with long-running tasks, it can be useful to see what it is doing and how long. But to avoid running into memory or processing problems, you can set limits. If you press the gear, left in the Diagnostic Tools, and select “Settings” you can see you can set a limit to disk usage, virtual memory, and the minimum session duration in minutes. Could come in handy when you want to make sure your application isn’t using all your memory.
Output
This window has several faces, but it is generally used for extra information. It can show the output of different parts.
If you can’t find the output window you might want to take a close look at the labels of your panes. In the image below you see the tabs Output, Locals, and Watch 1. Maybe you will see a Callstack tab too? Chances are that your Visual Studio opens a different pane by default. Click on the Output tab.
Don’t see Output anyway? Use the search option in Visual Studio to find and open it.
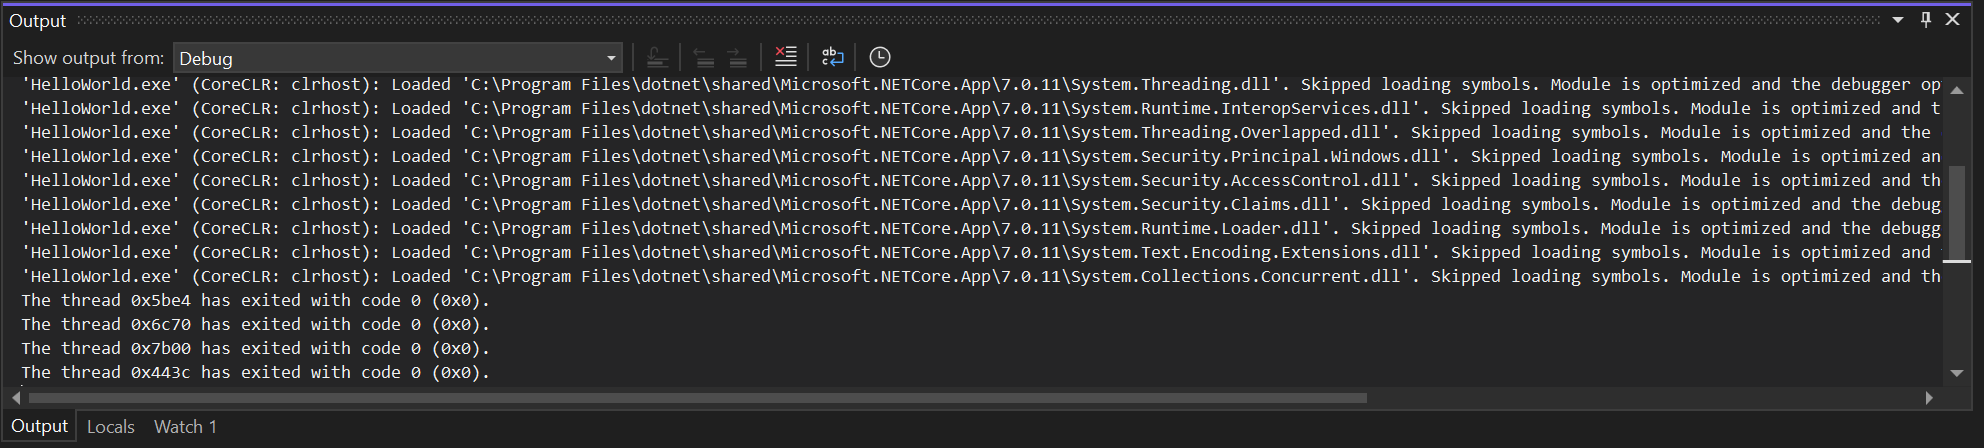
The most important one is the “Debug”, which shows the information output of your running application. You can also write information in this window by code. It also shows error messages.
Another convenient part is the “Build” output. This will be shown when you build your application. If errors or warnings occur during the build they will be shown here. It also shows what projects have been built. In the end, it tells you how many projects have succeeded, failed, or are up-to-date after build.
Although there isn’t much to tell about this window, I would advise you to keep it open and keep an eye on the Debug-output.
Callstack
A very important window while developing your projects. When an error occurs, especially an exception, this window shows the path the application has to take to reach this error. It also allows you to retrace your steps and see where it went wrong.

So, at this point, it might happen you have two panes in the same window. Like, output and call stack can be activated by clicking on the tabs. But what if you want the two to be visible at the same time? Simple: Drag the panes with your mouse by clicking and dragging the labels. Now you can place the panes wherever you want.
The code is halted on the line that has the yellow arrow. If you click on the line below it, which is the line of code that is executed before the current line, you will jump to that line. This way you can retrace the steps your code has taken to come to the point where it went wrong.
Immediate window
This window can be used next to the call stack. Let’s look at the image below.

Here you see some code. Don’t worry about it too much, it’s an example only. Running this code would result in the c is 5, not 3, thus the message C Should be 3, not 5 should be shown. Let’s investigate why this happened.
Now, what we can do is place a breakpoint in front of line 8. You do this by clicking on the gray, vertical bar left of the line numbers. A red dot appears. Run the application. The application will hold as soon as it hits the line with the breakpoint.
Open the immediate window. A nice little window that you can use to execute simple code when in debug. It’s an inline editor and when I type “c” in this window and press enter it shows “5”, the value of c. Cool!
Now I type c = 3 and press enter. It shows “3. I just changed the runtime value of c. Press F5 to continue executing the application. The message won’t be shown, because c is now 3, not 5.
Conclusion
These are just a few features of Visual Studio, but there is much… MUCH more. But you will figure them out along the way. As long as you know how to edit a file, run the application, and get some information, you will be fine.
Visual Studio is a really big tool with a lot of features and explaining them all is just not doable. Well, I could, but the article would be way too long.